European Foundation |
The tripartite EU agency providing knowledge to assist |
European Foundation |
The tripartite EU agency providing knowledge to assist |
Our print chart guidelines are here to help you create charts that are in line with Eurofound branding.
Download our Microsoft Excel document with ready-made templates and colour groups.
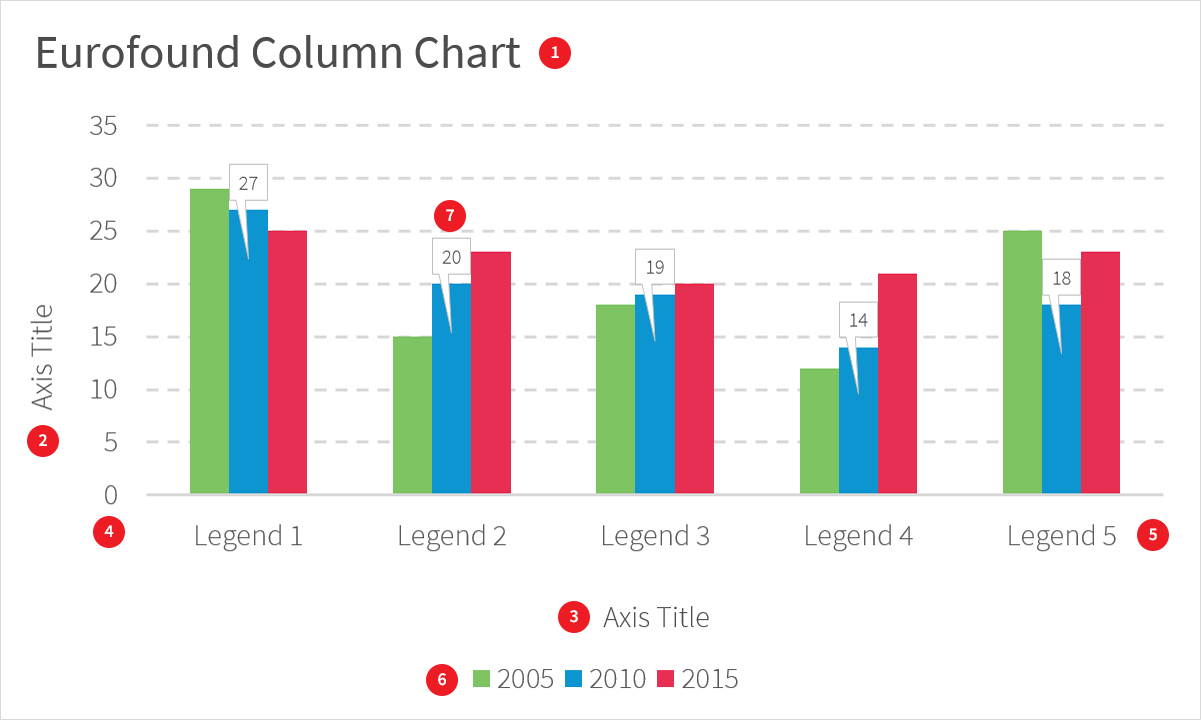
Titles within charts are not required if the title is within the body of content. However, if they are required, then they should be formatted correctly to match the style used in the examples below.
Please see Chart typography for all chart text formatting.
Axis titles are written in sentence case (all lower case except the first letter of the first word and proper nouns), for example ‘Number of people’.
Axis titles can be removed if the axis labels are self-explanatory, for example country names.
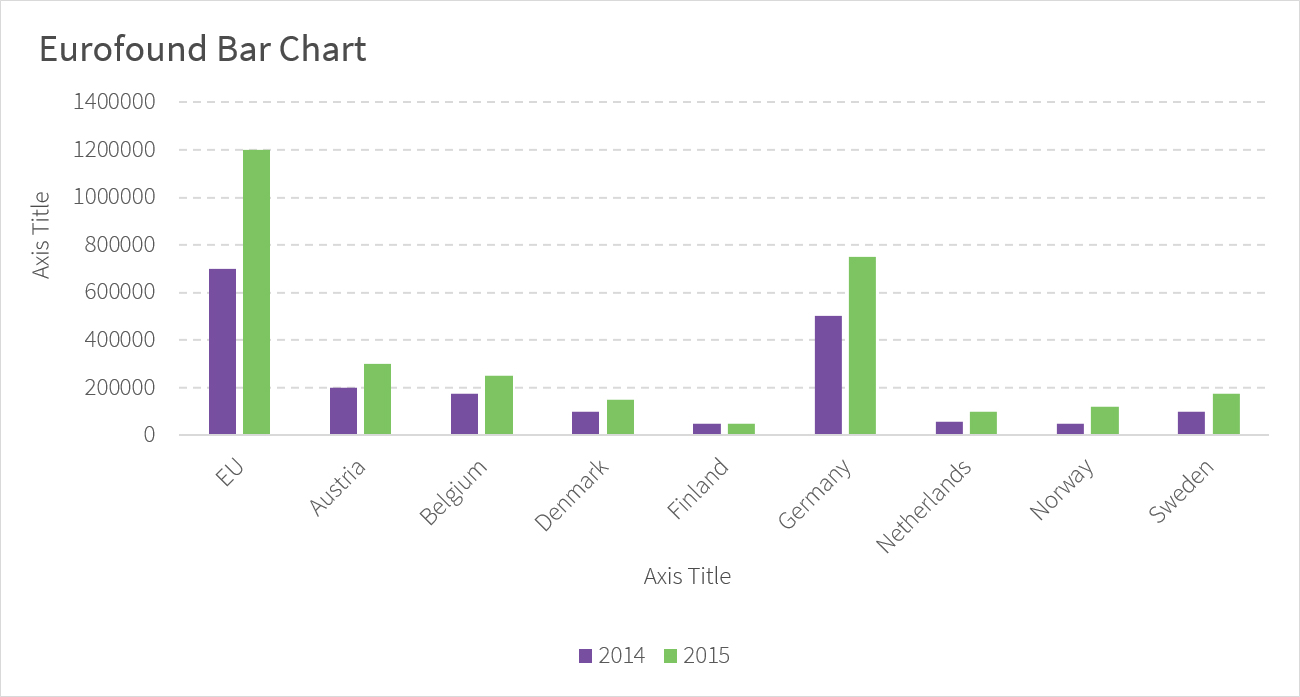
To ensure readability, the axis labels should be displayed horizontally or at a 45 degree angle. If the labels do not fit correctly on the 'X' axis, then it is recommended that the chart changes to something that is easier to read. For example, a column chart might have to change to a bar chart in order to accommodate for the size of the labels.
Use a comma as a separator for thousands (for example: 1,250 or 1,400,000).
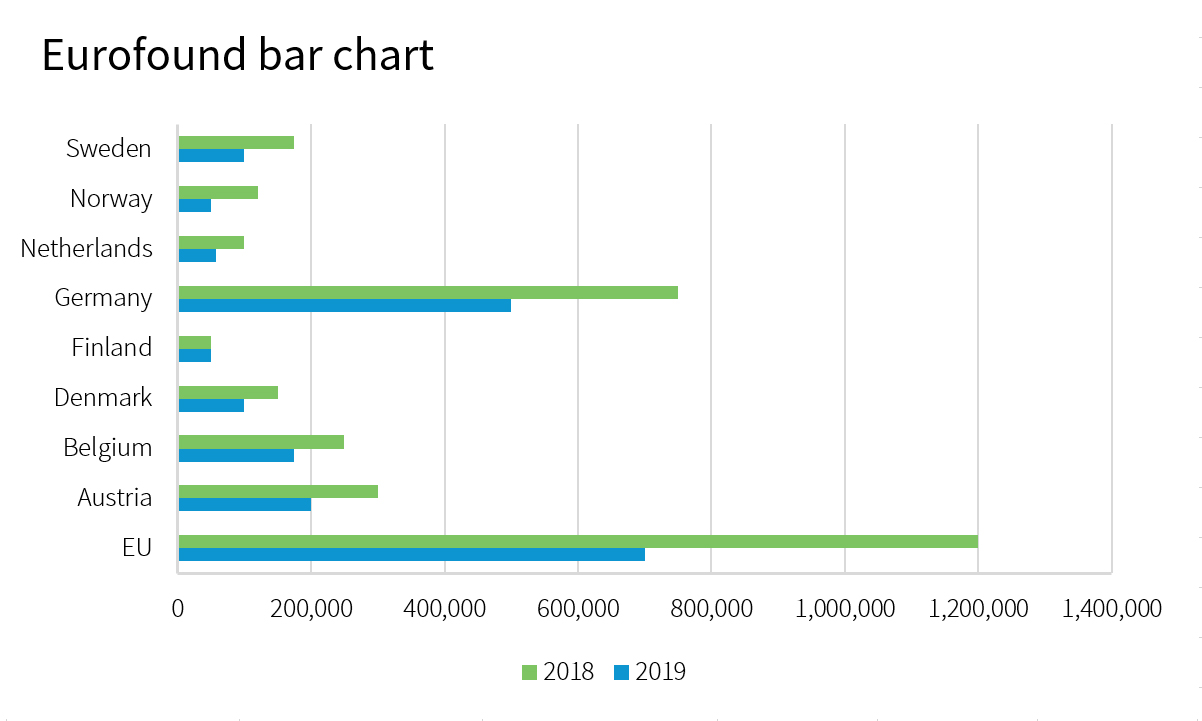
Bar chart axis label positions are different from other charts as they are reversed, with the numbers/ values along the X axis and the categories along the Y axis.
Wrong
Correct
The legend for charts must be centrally and horizontally aligned across the bottom of the chart area to ensure consistency. The legend must also not interfere with axis titles and data labels and must be clear enough to read.
EXAMPLE
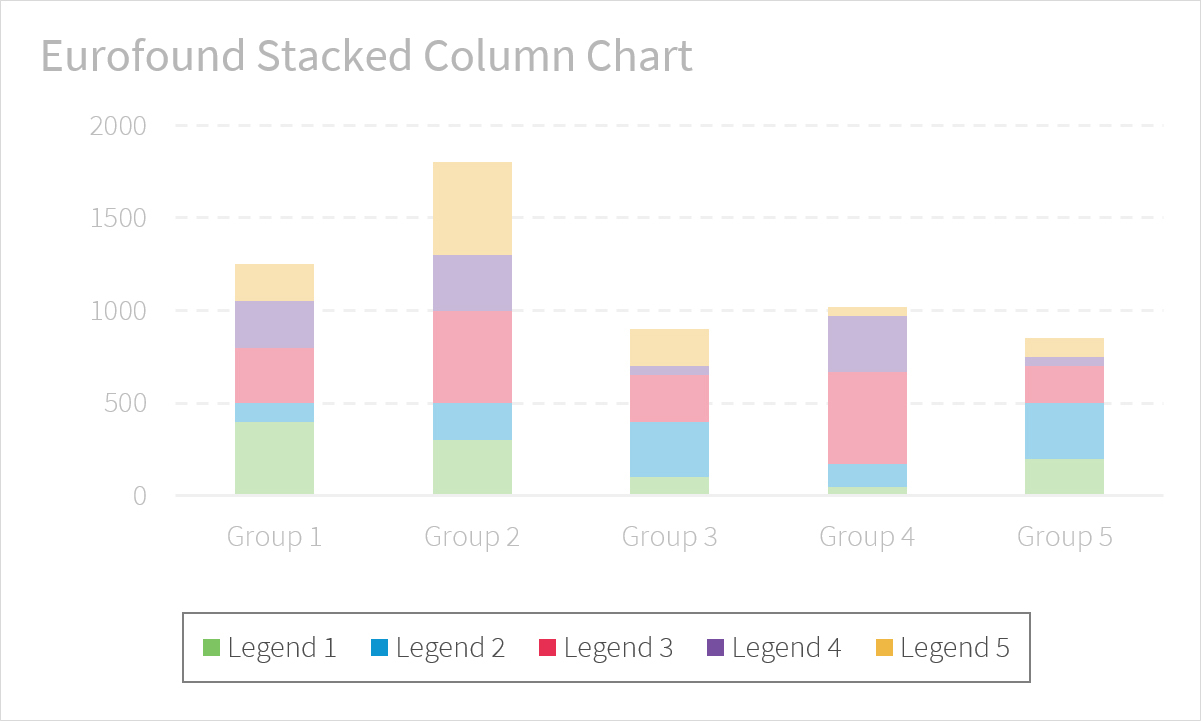
The legend categories must follow the order of how the user would read the data.
EXAMPLE
The data figure labels must be clear and easy to read without any overlapping. They must also not obstruct the chart elements.
Data figure labels do not need to be used if the chart is clear enough without them. Data figure labels can become intrusive when dealing with smaller charts so careful consideration should be given.
If used correctly, they should be displayed in a way that they do not intrude on other chart data such as other labels and remain clear and easy to read.
Wrong
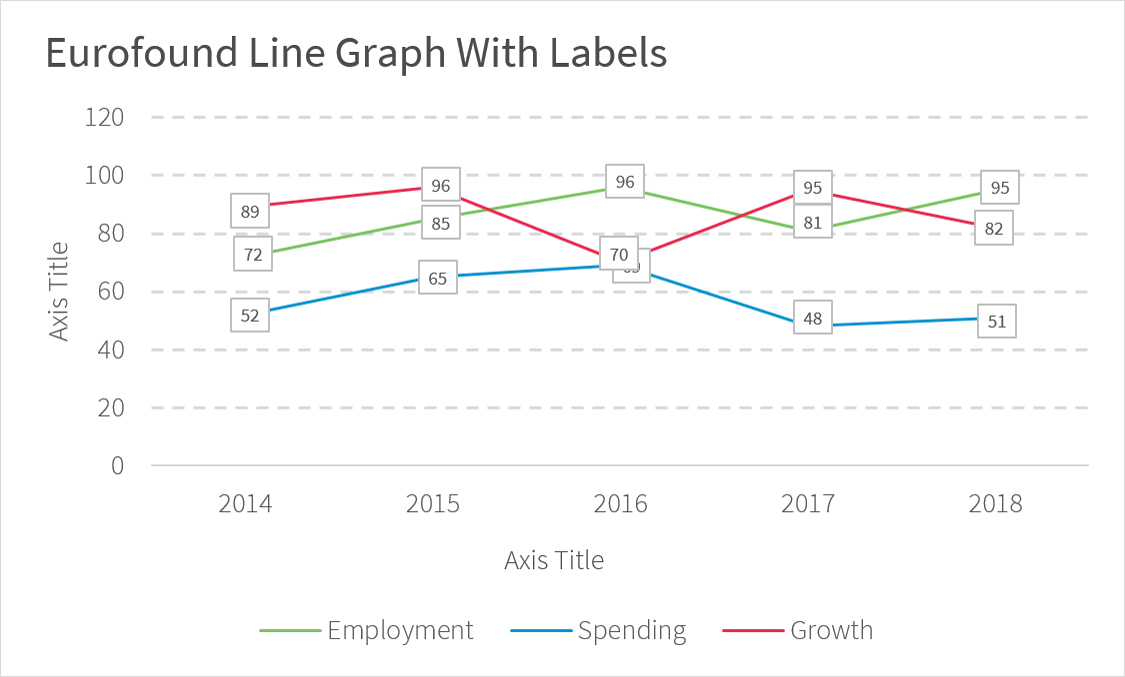
Correct
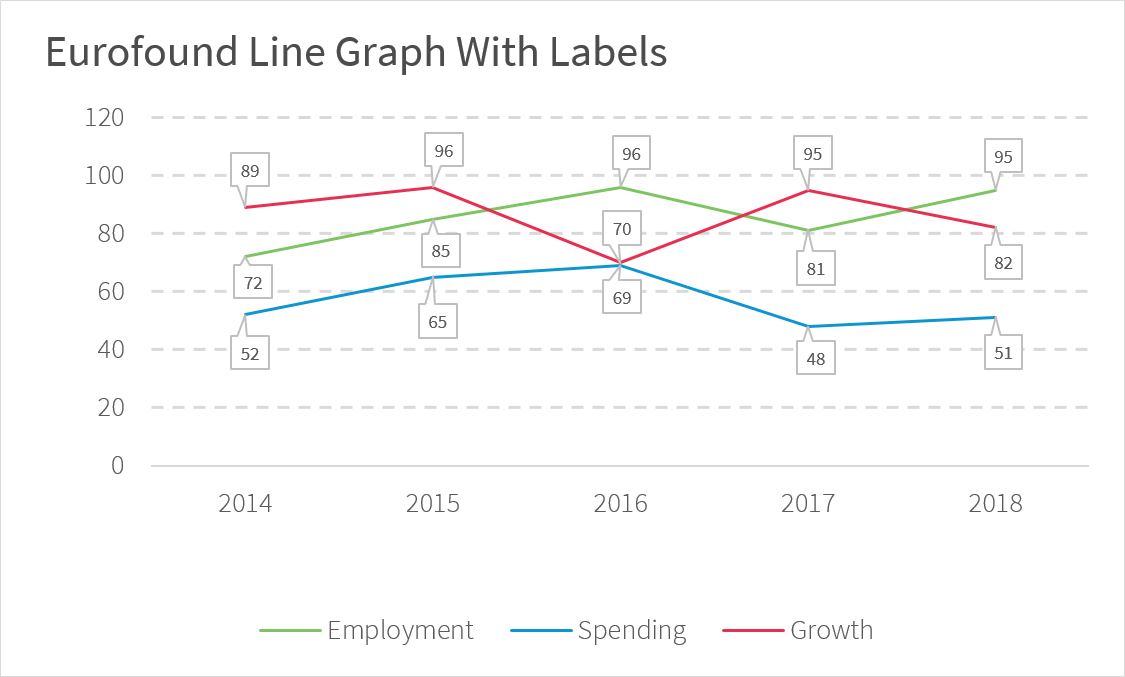
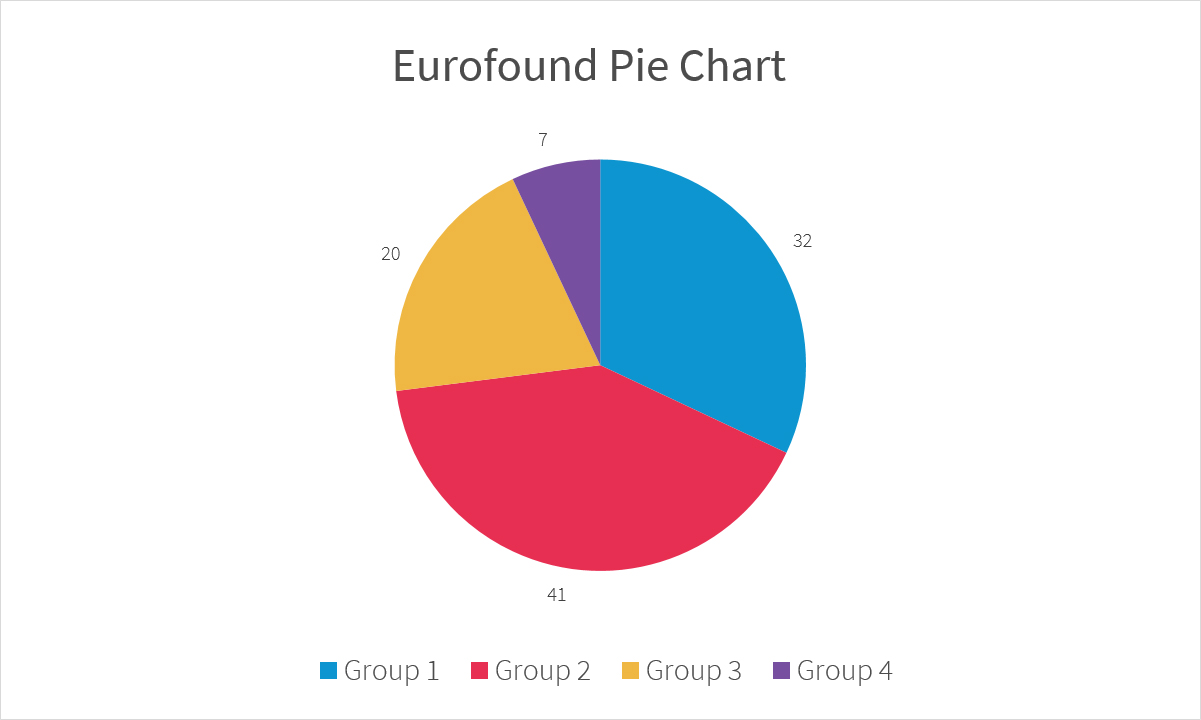
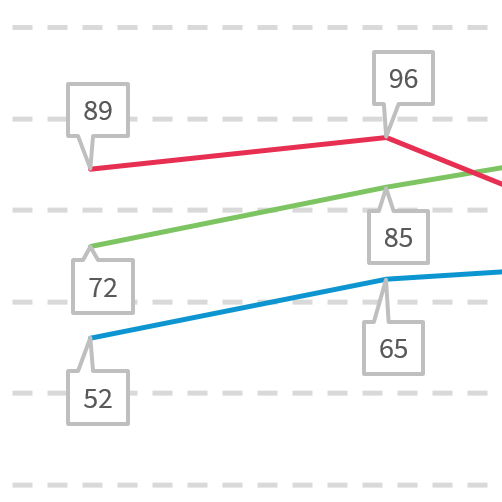
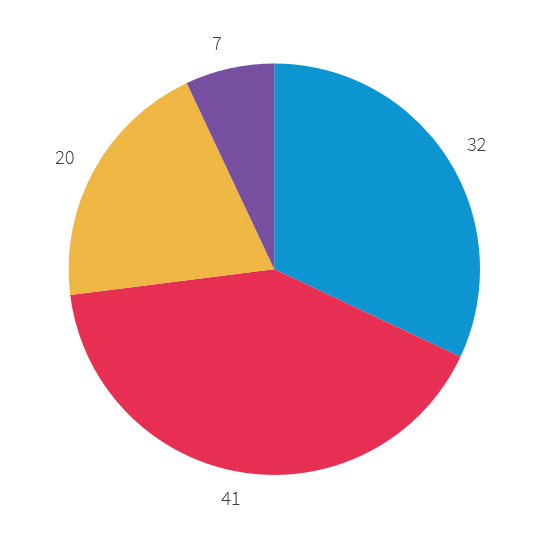
Data figure labels must be clear and easy to read. If they are placed over chart information such as line graphs, then they must have a white background with a grey border. If they are placed outside of a graph, such as a pie chart, they can be presented without a border or background as they do not interfere with the chart.
EXAMPLE: Data figure labels with a box
EXAMPLE: Data figure labels without a box
Eurofound uses a combination of Source Serif Pro and Source Sans Pro. Source Serif Pro and Source Sans Pro are open source fonts, available from Google Fonts.
Learn more about our typography.
Below is a table showing the typography attributes for text created in Microsoft Excel.
| Object | Text | Font | Size | Location | Colour |
|---|---|---|---|---|---|
| 1 | Chart title | Source Sans Pro Regular | 14pt | Left | RGB: 0.0.0
|
| 2 | Y Axis titles (Where required) |
Source Sans Pro Light | 8pt | Centre Vertical | RGB: 0.0.0
|
| 3 | X Axis titles (Where required) |
Source Sans Pro Light | 8pt | Centre Horizontal | RGB: 0.0.0
|
| 4 | Y Axis labels | Source Sans Pro Light | 8pt | Centre Horizontal | RGB: 0.0.0
|
| 5 | X Axis labels | Source Sans Pro Light | 8pt | Centre Horizontal | RGB: 0.0.0
|
| 6 | Legend | Source Sans Pro Light | 8pt | Centre | RGB: 0.0.0
|
| 7 | Data figure labels | Source Sans Pro Light | 6pt | Centre | RGB: 0.0.0
|
Axis lines along the X and Y axis should be included for each graph.
The Eurofound data visualisation colour palette, which is a separate colour palette specifically created for charts should be used.
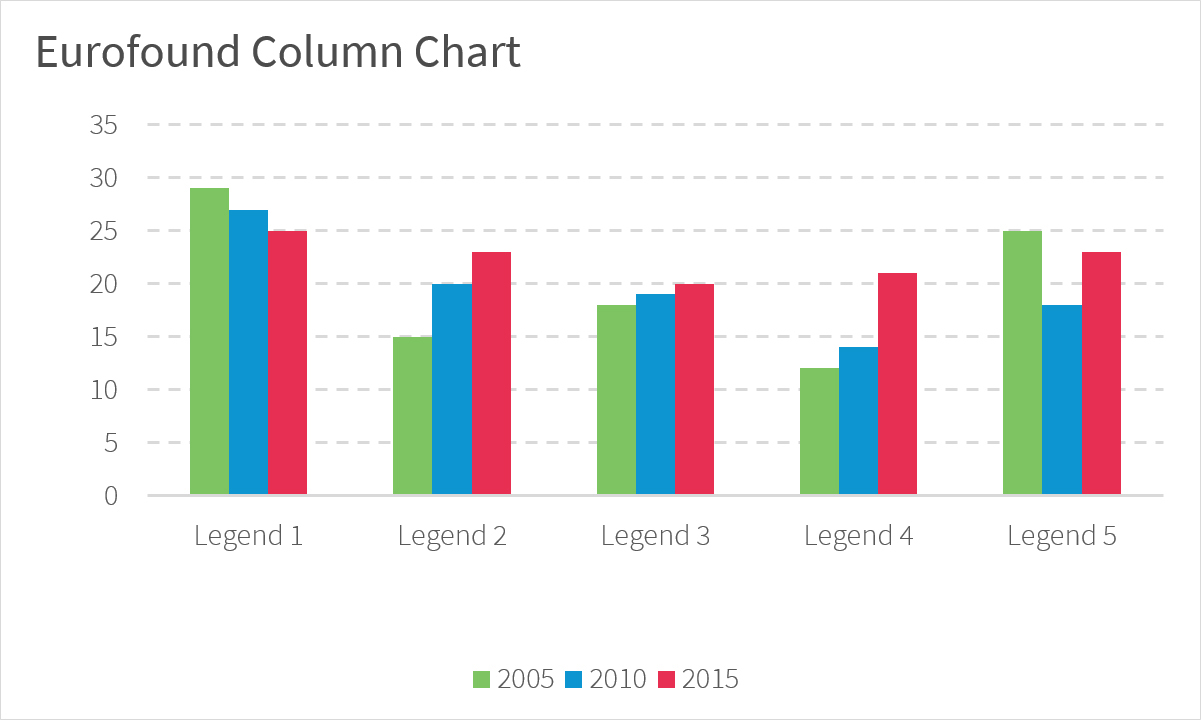
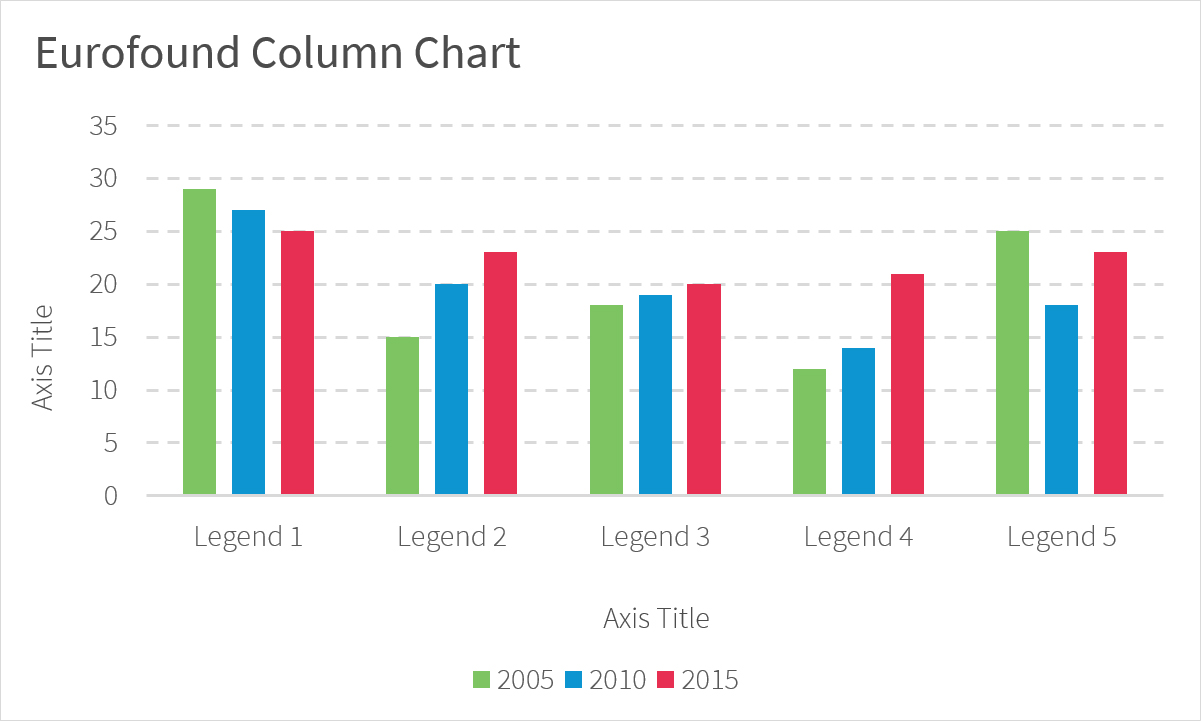
The specified colour sets must be used depending on the number of data groups. Below is an example of a column chart with three data groups, the incorrect example shows the wrong use of colour, while the correct example shows the colour set that is specified for use with a chart that has three data groups.
View our colour palette.
Wrong
Correct
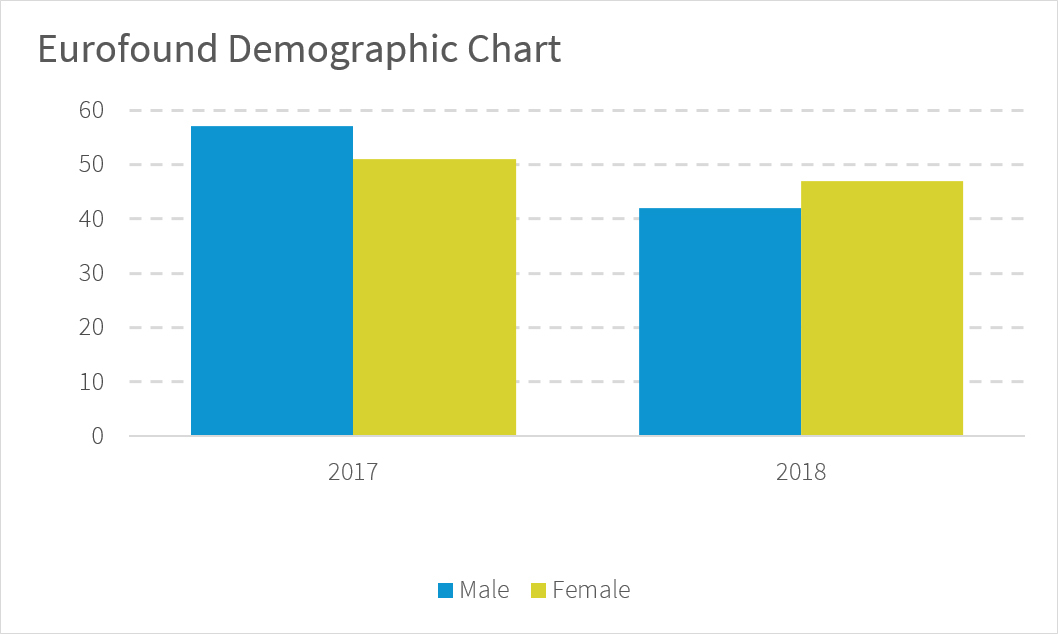
A specific colour set has been created to present separate data for men and women and must be used whenever using gender within a chart.
EXAMPLE: Men and women demographic chart
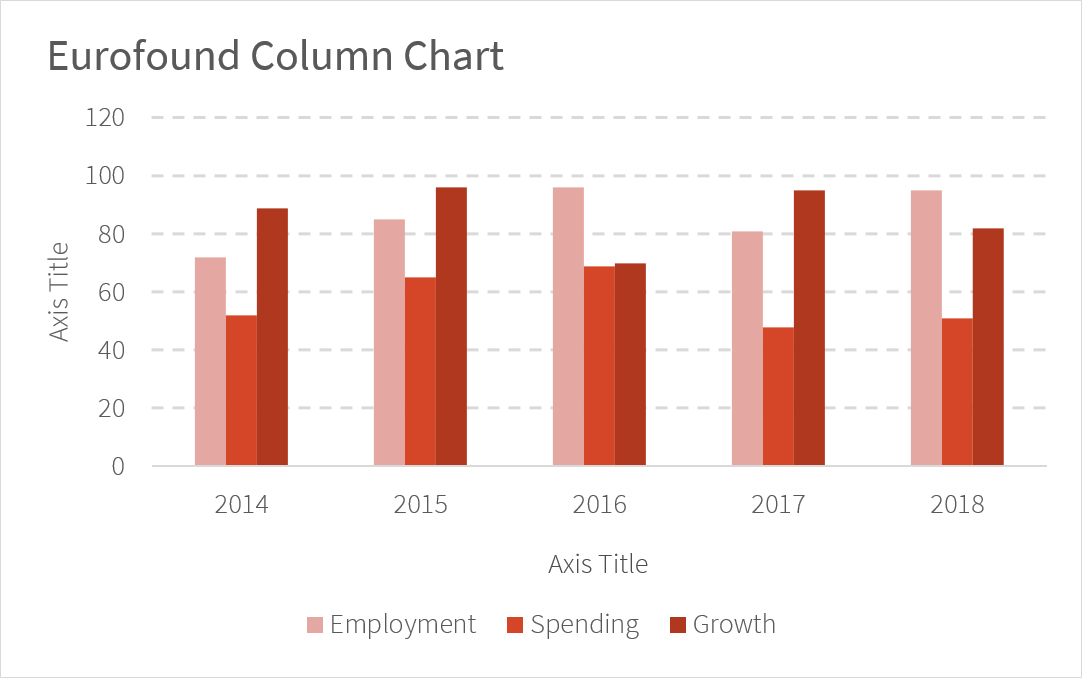
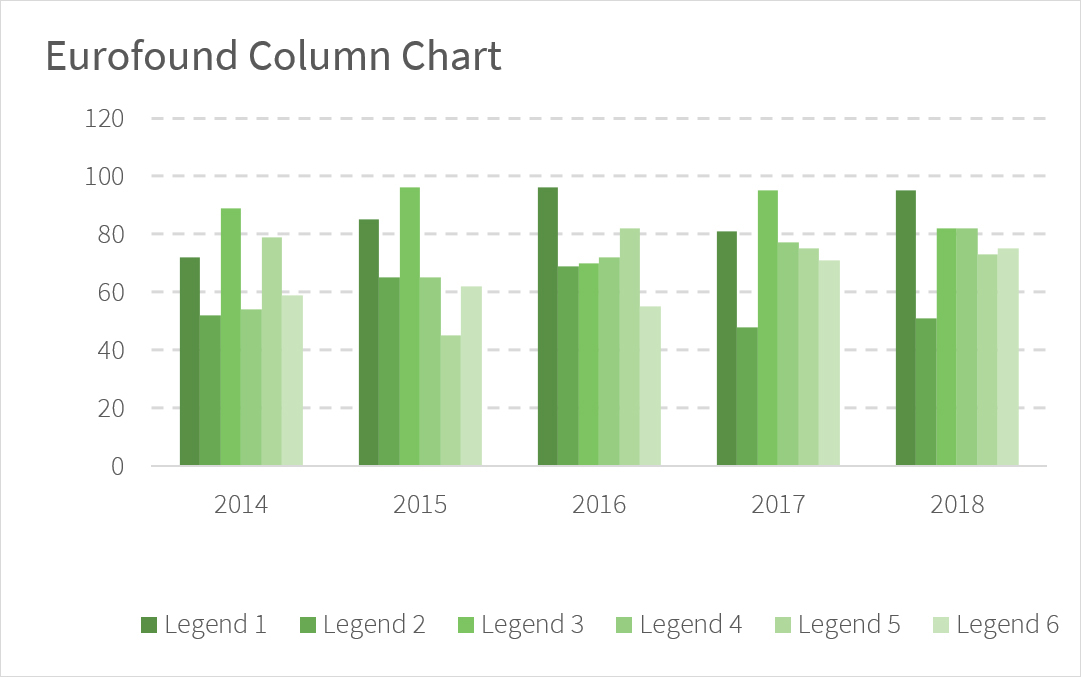
A set of colour shades has been created for the main colours. These shades can be used when multiple charts are being used to illustrate different sets of data together. This helps break the charts up and the reader will be able to differentiate the charts from one another.
To ensure consistency the colour shade groups should be used starting with the darkest colour.
EXAMPLE:
When creating charts, you must make sure that there is an appropriate amount of space between data groups, data and axis labels, titles and legends. While there is no set spacing, the chart should not look overcrowded or cramped. All of the data must be easy to read and understand.
Wrong
Correct
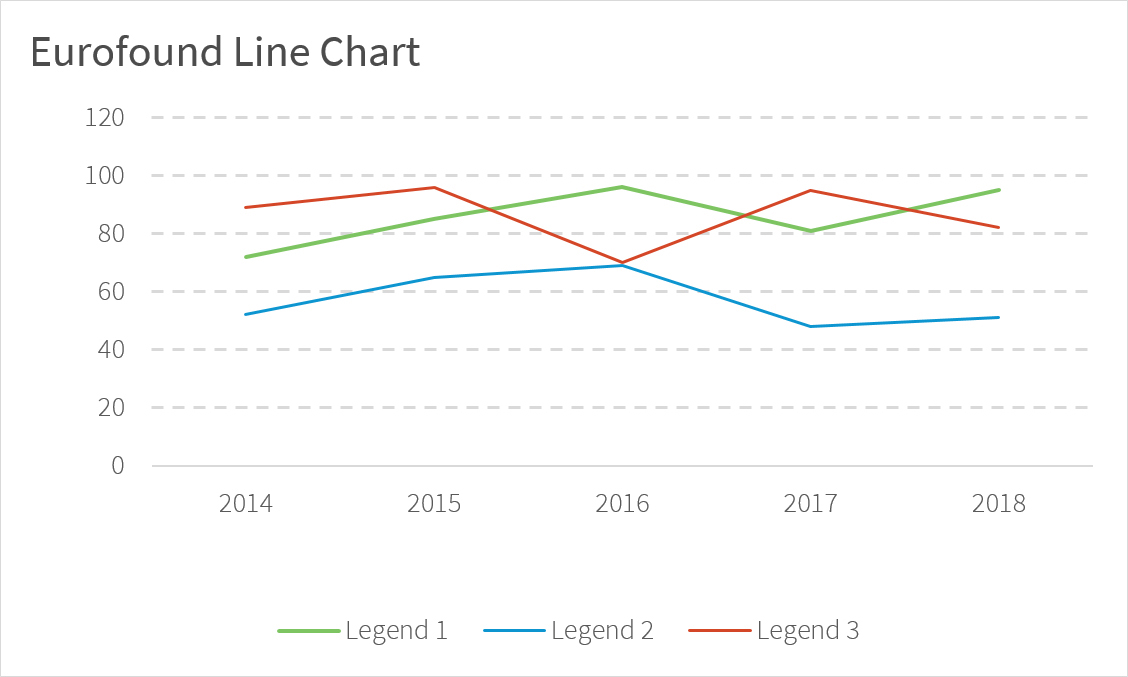
This refers to the line weight of certain charts, for example, line graphs.
The size of the charts should allow the user to clearly see the information. Typographic information such as axis, data labels and legends have a set size and shouldn't be changed. This will ensure consistency across all charts being used despite the size of the chart area. If the chart used looks too cramped and is difficult for the user to read, then an alternative chart should be considered.